What are “Psychological” Networks based on your understanding of the literature?
Psychological networks focus on comorbidities and co-occurrences of emotions, symptoms, and personality traits as interconnected nodes. The edges in these models showcase statistical relationships, not just a single underlying cause. They are very complex and interact with each other.
Psychological networks focus not on the individual symptoms of an illness, but on the interactive network of components and both internal and external causes that build into one larger outward psychological expression (an emergent behavior)
Sacha Eskamp says: “A psychological network is a model in which nodes represent observed psychological variables, usually psychometric test items such as responses to questions about whether a person suffered from insomnia or fatigue in past weeks. These nodes are connected by edges which indicate some statistical relationship between them. These models are conceptually di↵erent from commonly used reflective latent variable models that explain the co-occurrence among symptoms (e.g., the fact that individuals often su↵er from sadness, insomnia, fatigue, and concentration problems at the same time) by invoking an underlying unobserved latent trait (e.g., depression) as the common cause of all the symptoms.” (“Estimating psychological networks and their accuracy”)
Distinguish the type of networks used by authors of the readings from what we have covered thus far in the seminar
Centrality indices, esp closeness and betweenness centrality, have been shown to be unstable in some cross-sectional and temporal networks (Bringmann)
Gaussian Models can’t disentangle the within and between subjects effects when using cross-sectional data
Centrality metric have been suggested to reflect the importance of nodes to the system but for certain networks, peripheral nodes may be more important in determining system behavior, making it hard to interpret centrality in terms of causal dynamics.
In directed networks there is an indegree or instrength centrality and outdegree/outstrength centrality: nodes that receive the most edges and nodes sending the most edges (thought to provide info both on how symptom directly activates and is activated by other symptoms) (Bringmann)
Undirected networks like Gaussian and Ising (and lasso by proxy) can also draw upon instrength/outstrength or indegree/outdegree measures like the centrality metrics we discussed in week 2.
Community Detection Walktrap methods seemed to have almost a 100% recovery rate for sparse count matrices, and really good performance on small and large graphs alike for correlation matrices; it was even recommended for long-term brain studies (Gates).
Lasso, and the models that use it (Gaussian, Ising, glasso) loves assuming models are sparse, which makes it good at things like sparse count matrices. That being said, for some of these models, size was a barrier; Ising is bad for large dense networks and glasso is bad for smaller networks, whereas Walktrap works for both sizes.
If the assumption that a mental disorder is best explained as a network of symptoms, thus, comorbidity being viewed as a network of symptoms of two disorders, then the boundaries are fuzzy because they do not exist (Cramer).
The partial correlations
GGM is an undirected network of partial correlation coefficients assuming that observed variables follow a multivariate normal distribution with variance through covariance matrix Σ. GGM works a bit backwards, not focusing on Σ directly but the inverse K = Σ⁻¹ (the precision matrix).
When a partial correlation equals zero, no edge will be drawn between corresponding nodes. No edge means the variables are independent. These are conditional associations rather than marginal; marginal associations between variables are rarely zero but conditional ones are capable of being zero, allowing for sparse modeling.
GGM relates to multiple regression. If each variable regresses on all others, the regression coefficients are proportional to the elements of precision matrix K
If K = 0 then one variable doesn’t predict another; this prediction tends to be symmetric knowing variable 1 predicts variable 2 means knowing variable 2 predicts variable 1.
What characteristics do “psychological” networks tend to have that networks in other fields do/do not have?
Undirected and weighted
Most psych networks are cross-sectional, and Pairwise Markov Random Fields (PMRF). Multivariate data is analyzed by looking at direct relationships between pairs of nodes while controlling for all others (partial correlations). Since partial correlations don’t have direction, the resulting network has undirected edges.
The majority of network modeling uses conditional associations, when two variables are probabilistically dependent on each other. The strength of this conditional association is represented as an edge weight.
These conditional associations or weights, are bound to each other in a sense that, once the association between the two nodes can be explained by a different node or variable, the conditional association or weight, will then disconnect or vanish in the network representation.
Edges are estimated
We take networks with multivariable data. Each variable is a node, and we use statistical parameters like partial correlations to connect the nodes, to estimate which variables are directly connected. This process is called the network structure estimation.
Because we are using estimation, measurement error and sampling error need to be taken into account when interpreting psychological models, which is why researchers use techniques such as graphical lasso.
Can you think of ways that psychological data could be gathererd to better reflect the networks in other fields?
Co-occurrence/Comorbidity
Co-occurence is calculated and considered in the Ising Model (Haslbeck)
Bos et al. : Cross-sectional networks do not accurately represent how symptoms (nodes) influence each other over time. While it can still be useful in capturing general patterns of comorbidities, dynamic network analysis can provide more understanding on how disorders develop and which symptoms need to be targeted.
What is a “partial correlation?”
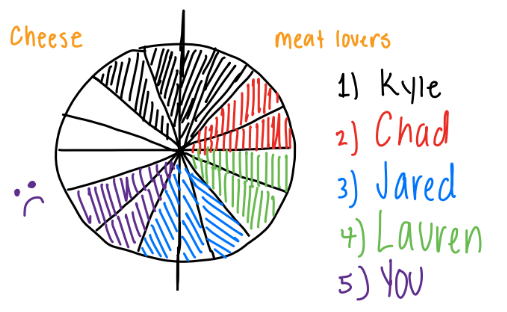
ENTER: The Pizza Party
You’re at the party and frat boy Kyle brings in a pizza; half cheese, half meat lovers. But Kyle has already eaten four slices of pizza and a fourth of the damn box is empty (way to go Kyle). Kyle ate two slices of cheese and two slices of meat lovers.
It turns out that frat boys love pizza and they are indeed lovers of meat lovers pizza. Frat boy Chad drunkenly stumbles over and takes another two slices of the meat lovers. If Kyle hadn’t fisted a fourth of the pizza he may have had a third slice, but even drunk, - Chad knows party etiquette so he sticks to only two slices of meat lovers pizza.
Only four slices of meat lovers remain. Frat boy Jared walks up and grabs three pieces of pizza: two are meat lovers, one is cheese. He’s hungry but he is not a monster.
You realize while you were wasting time psychoanalyzing frat boys that there is limited time to capitalize on that ’za bro. Right as you rush to get yourself a slice, sorority girl Lauren swoops in and takes the last two pieces of meat lovers. She brings them…..RIGHT TO KYLE ARE YOU KIDDING ME.
Dejected, you grab two slices of cheese pizza and sulk in the corner, swearing this is the last time you go to a frat party, no matter how good the pizza tastes.
Here is a visual depiction of our pizza:
Anytime a variable is added to a pie, there are more partial correlations.
Parts that each of these variables want, they may overlap, and if they overlap, each of them gets less.
Kyle and Chad got to the meatlovers first so Jared takes less and you get none despite the fact that you all wanted that part of the pizza pie
In terms of psychology:
As nodes get increased in networks, it gets more complex.
Sometimes in networks, there may be emotions or symptoms that don’t get added as a node.
People may not know nuanced or finite definitions that educated people may now.
If depression eats 70% of anxiety pie, then other variables won’t look as important even though they are equally important.
Network models in psychology estimate partial correlation between variables: direct association between any two variables AFTER controlling for all others.
Why do we use partials?
We use partials to figure out which correlations are indicative of direct causal relations and which are not. (Borsboom & Cramer 15). They help us isolate direct statistical associations between specific nodes to find the “causal skeleton.”
Network structures depend on which variables are included. Nodes that are highly central in one network can be peripheral in another.
If important nodes are missing, this can affect the structure of the network like increasing edge strengths among nodes that represent effects of an omitted common cause.
If nodes have topological overlap, or similar properties, it will influence the network structure as well. Researchers need to be careful about which nodes to include or not, and be mindful of the strength of correlation they give to its edges (Borsboom et al. 14).
The GGM (Gaussian Model) has clear parameters that are easy to interpret edges as partial correlation coefficients
Question: Can you think of any reasons that might contribute to why we might use partial correlations to analyze the nodes other than the reasons I listed above?
Answer
Everything in the world is correlated. Conditioning for other things means that all relations change when I include even a single new thing
Partial correlations are NOT sparse.
This topic of partial correlation and making them sparse is also touched upon in Gaussian Models as discussed by Sacha Epskamp:
GGM is an undirected network of partial correlation coefficients assuming that observed variables follow a multivariate normal distribution with variance through covariance matrix Σ. GGM works a bit backwards, not focusing on Σ directly but the inverse K = Σ⁻¹ (the precision matrix).
GGM is interpreted in three stances:
Predictive Effects: without causal interpretation, GGM can be interpreted just to show which variables predict one another
Indicative of Causal Effects: GGM and causal modeling go hand in hand. Edge A-B only appears in the GGM if there is a causal link between the variables (or both if a third variable is present). This means edges in GGM may be interpreted as showing potential causal pathways
Causal Generating Model: Undirected network models are commonly used as data-generating models in many fields of science (like physics). Think of the Ising model where intervening on one variable impacts the other and vice versa, creating symmetric effects. This part, Epskamp doesn’t dive too deep into but it is a stance one could use (due to GGMs ability for symmetry)
Epskamp also compares GGM to Causal Directed Acyclic Graphs (DAGs); he notes two big problems with DAG that make GGM a good alternative:
Underidentification: In DAG, the inclusion of m variables make the model underidentified if there aren’t enough restrictions on B
Equivalent Models: the same covariance structure can be obtained under different specifications of B; even with more variables, many models will note the same things in DAG
This is what makes GGM sound so good, it is saturated, but not overidentifying all the edges are present. There are no equivalent models, no question of the direction of causal effect, and no need to assume acyclicity. The cost? We lose direction of effect completely.
Variance in Three Network Structures
Temporal Network: a directed network showing how variables predict each other at the next measurement occasion after considering all other variables at the previous measurement (can highlight potential causal pathways due to satisfying the temporal requirement for causation: cause must precede effect)
Contemporaneous Network: describes relationships that remain after you control for the temporal effects; this GGM models effects withing the same measurement occasion. This network is to account for causal relationships that occur faster than a typical ESM study (this speed is more common in psych studies)
Between-Subjects Network: formed on the covariance structure of stationary means across subjects; this GGM describes how scores of different subjects relate to one another. Epskamp says this could be indicative of potential causal pathways, especially those operating with long-term or structural changes rather than more short-term fluctuations
Any correlation matrix, \(\mathbf{\Psi}\) may be converted into a set of partial correlations using the precision matrix, \(\mathbf{K} = \mathbf{\Psi}^{-1}\), where:
\[P_{ij} = -\frac{\kappa_{ij}}{\sqrt{\kappa_{ii}\kappa_{jj}}}\] Alternatively, it can be calculated in matrix form by defining a diagonal matrix, \(\mathbf{D} = \text{Diag}(\mathbf{\Psi})\) and \(\mathbf{I}\) is the identity matrix:
Both of these result in identical results but the latter is a matrix form of the former.
Below, I read in a raw correlation matrix that has \(40\%\) sparsity and then I convert the correlation matrix into a partial correlation matrix using the equations above.
The transformation equation is important to discuss; what is not important is detailing how/why the equation works the way it does. The more important question you should focus on relates to whether “sparsity” is something we expect in reality.
Note in the correlation matrix below, we do observe sparsity but in the conversion to a partial correlation matrix, sparsity is not preserved.
Registered S3 method overwritten by 'GGMnonreg':
  method     from
  plot.graph GGMncv
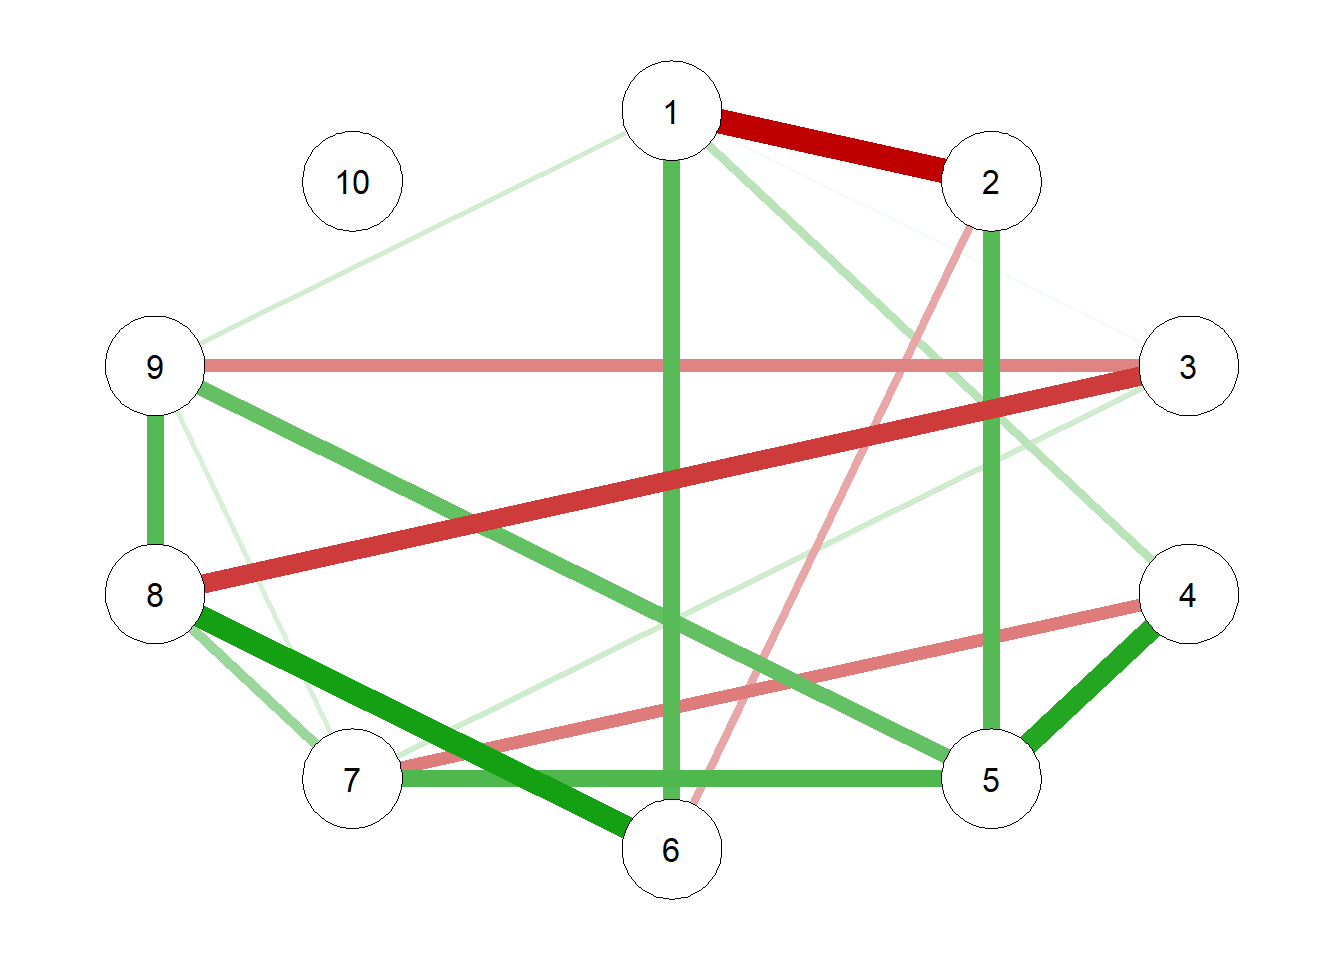
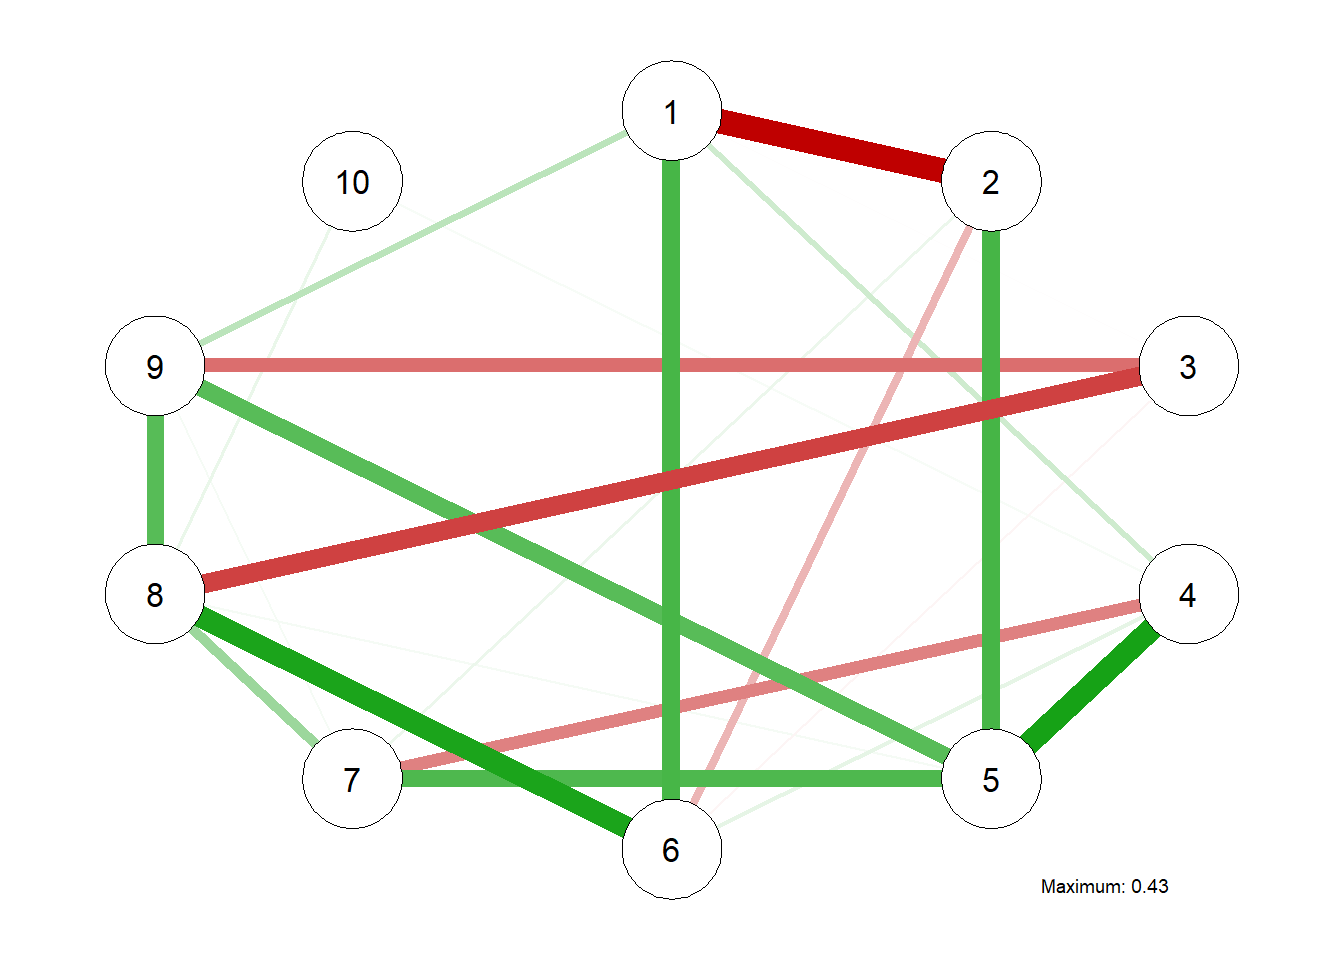
set.seed(89181)# Generating True Model true.pcor =ggm.simulate.pcor(num.nodes =10, etaA =0.40)# qgraph(true.pcor, edge.labels = TRUE)# Generating Data From Model m.sim =ggm.simulate.data(sample.size =600, true.pcor)## Covariance implied by Data CovMat =cov(m.sim)# Modeling the true correlations G1 =qgraph(true.pcor)
Note that there are 10 nodes and 40% of 45 connections are present (a sparse partial correlation matrix)
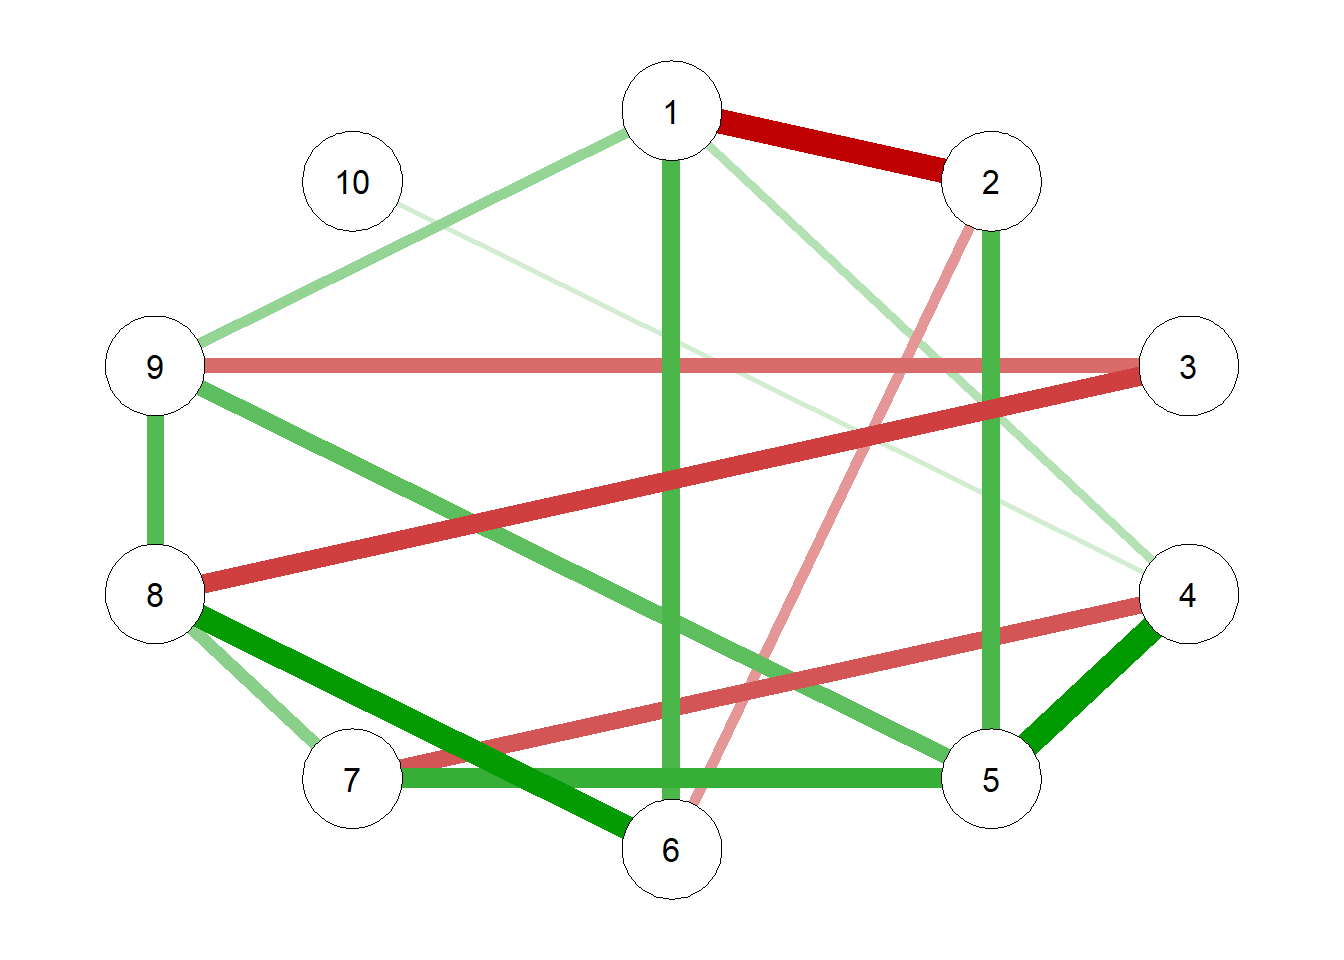
2)Let’s generate our Lasso graph:
# Estimating the EBIC Graphical LASSO Network Model EBICgraph =qgraph(CovMat,graph ="glasso",sampleSize =nrow(m.sim),tuning =0.50,details =TRUE)
Warning in EBICglassoCore(S = S, n = n, gamma = gamma, penalize.diagonal =
penalize.diagonal, : A dense regularized network was selected (lambda < 0.1 *
lambda.max). Recent work indicates a possible drop in specificity. Interpret
the presence of the smallest edges with care. Setting threshold = TRUE will
enforce higher specificity, at the cost of sensitivity.
We should be expecting shrinking, with more sparsity.
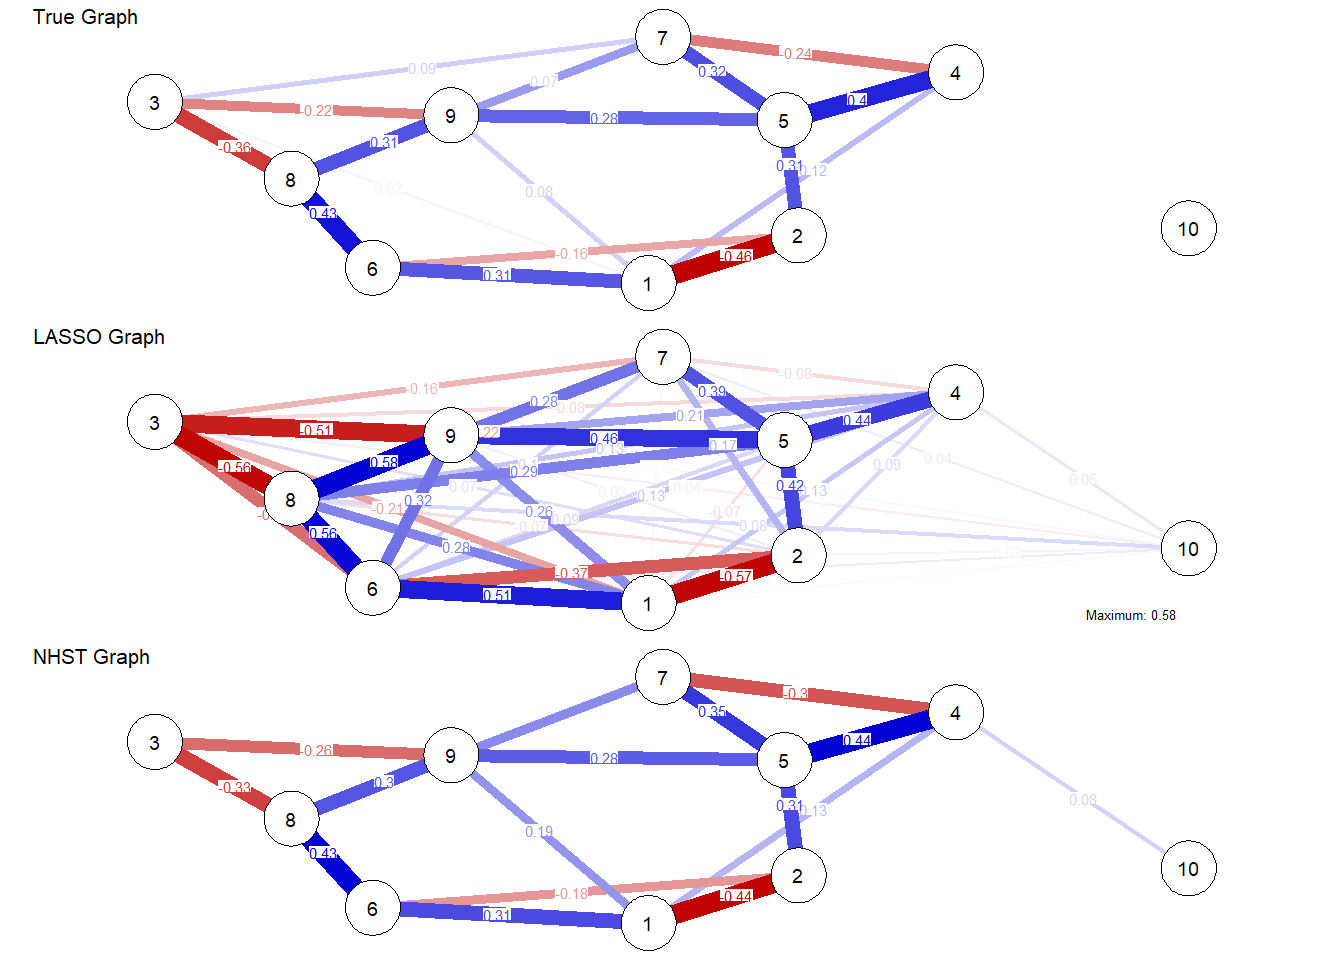
Finally, our third graph is our Null Hypothesis Significance Test (NHST):
# Estimating the NHST Gaussian Graphical Model and Generating a Plot; Williams et al,# Does not have shrinkage as an issue NHSTgraph =ggm_inference(m.sim, alpha =0.05)
This is a more statistical method of generating the data.
Question: What are your thoughts on what we have generated?
Comparing Networks Example
A lot of final projects want to compare networks. Let’s look at how we might be able to achieve that.
# Network Comparison Testlibrary(NetworkComparisonTest) true.pcor1 =ggm.simulate.pcor(num.nodes =10, etaA =0.20) true.pcor2 =ggm.simulate.pcor(num.nodes =10, etaA =0.50) m.sim1 =ggm.simulate.data(sample.size =100, true.pcor1) m.sim2 =ggm.simulate.data(sample.size =100, true.pcor2)# Elaborating on options and results; in this case, networks differ:# In structure but not in global strengthNCT(m.sim1, m.sim2, it =2000)
 NETWORK INVARIANCE TEST
 Test statistic M:
 0.7313794
 p-value 0.0004997501

 GLOBAL STRENGTH INVARIANCE TEST
 Global strength per group:  4.736806 2.810594
 Test statistic S:  1.926212
 p-value 0.189905
# NCT(m.sim1, m.sim1, it = 2000)
This example has us first test for 20% of present connection, then 50%, then simulate the data from both and compare the two sets. The final observation will tell us two things:
Do the two sets differ?
We have two different % so they should differ. This is our “sanity test”
Check our p value, is it less than .05? Yes! So they differ!
On a global scale, do these two networks differ?
Now the real test, do the networks differ on a global scale?
Check our p value, is it less than .05? No! So they do not differ!
Taa-dah! We did it!
Purpose of Regularization
Statistical purpose
To find the objective function for LASSO on a simple linear regression
Correlations are sparse but partial correlations are not sparse.
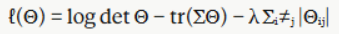
Regularization can help fix that; let’s take a look at regularization through glasso in Williams’ terms:
Network models in psychology estimate partial correlation between variables: direct association between any two variables AFTER controlling for all others.
To do this you need to invert the covariance matrix to get the precision matrix.
This is difficult because if you have a large p (number of variables) and a smaller n (number of observations) the matrix inversion becomes unreliable or difficult to execute.
Into the ring comes the graphical Lasso AKA glasso, saving the day via something called a penalty. Glasso penalizes the estimation process, maximizing a penalized likelihood. This is done using a Fresno nightcrawler: λ.
λ is the parameter that controls the strength of glasso’s penalty. If λ is zero, you would get your typical maximum likelihood estimate. If you make λ bigger, more edge estimates will be pushed to become zero, creating something called a sparse network (where most pairs are considered unconnected)
Sparsifying behavior is shown as ℓ₁ aka ℓ₁-norm penalty (this is the Lasso!) which applies regularization when estimating your network model.
To choose the best nightcrawler for the job, psychology typically uses glasso alongside the EBIC or Extended Bayesian Information Criterion.
E represents the number of nonzero edges. y ∈ [0,1] is a parameter that can add more penalization in larger models. If y=0, EBIC downsizes to just BIC (no longer extended); in psychology, they tend to use y=0.5 which favors sparser networks. This equation will evaluate the candidates of λ until it finds whatever will produce a network that has the lowest EBIC. This process is referred to by the Williams et al. reading as glassoEBIC.
Empirical purpose
Regularization exists to create an interpretable by forcing weak connections between nodes to become 0. LASSO produces a sparse network so that it provides a clean map that highlights robust and crucial node relationships in an otherwise complex looking network.
Does regularization align with our conceptual understanding of real-world psychology?
Is reality, sparse?
No, because LASSO exists to highlight strong and more meaningful relationships within certain parts of the network by penalizing the rest of the network to look sparse. In reality, networks in general cannot be sparse, therefore it can be argued that it does not align with our conceptual understanding of real-world psychology.
For illustrating any of these concepts, you can draw on any set of data or we can–during our meeting–generate some data depending on what you want to illustrate.
For estimating GGMs, you can estimate them in various avenues. I would recommend:
Strengths, limitations, and thoughts regarding these types of “networks”.
Question: What do you think the setback of Williams’ glasso method is?
Answer
Unfortunately, glasso was designed with larger networks in mind, specifically ones with high-dimensional settings. Psychology tends to be more focused on observations rather than variables, making them low-dimensional; this is not something glasso does well with.
When sample size grows, so does the false-positive rate of glassoEBIC; this is explained by the fact that neither λ nor y have a direct correspondence with the false-positive rate, which has made it hard for researchers to to control the spurious edges.
While glasso initially seems great to outside enjoyers of its large network benefits, such as its ability to solve the multiple-testing problems and produce interpretable sparse networks without arbitrary significance thresholds, these benefits are simply not seen in the world of psychology.
Question: What do you think the strength of using the Gaussian model is?
Answer
GGM is uniquely identified, one unique solution for every covariance matrix
Doesn’t need acyclicity (unlike DAG estimation); you do not need to assume causal effects are non-cyclic (uncommon assumption in psychology)
Clear parameters that are easy to interpret edges as partial correlation coefficients Lasso makes it fast
Close relation to causal models; no need to commit to specific causal direction
Question: What do you think the setback of using the Gaussian model is?
Answer
Loss of direction of effect (undirected network); unlike DAG
Edges may appear in GGM absent form the underlying causal model (ghost edges) when two variables both cause a third variable; cannot detect the ghost edges with GGM alone
Ghost edges (spurious edges) can also form if an unmeasured latent variable causes 2+ observed variables; GGM can’t protect against this
LASSO is at the party; LASSO assumes true model is sparse 🙁
Can’t disentangle the within and between subjects effects when using cross-sectional data
Assuming multivariate normality means any non-normal data will not capture likelihood correctly
GGM is only exploratory, you cannot confirm causal relations
Question: Which graphs/networks are amenable to correlation-based data?
Answer
GGM (Gaussian) has clear parameters that make edges easily interpretable as partial correlation coefficients BUT because it is only exploratory, you will not be able to confirm causal relations.
The lasso model penalizes coefficients towards zero, meaning that weaker but real connections are missed. van Borkulo argues this is alright because the strongest connections are correctly identified at the cost of missing those weaker ones. So it is partially amenable but really easy to royally mess up (with the p value).
Glasso and Ising are less amenable because glasso is more suitable to larger sample sizes (not common in psych) and Ising is hard to replicate and hard to follow the thought process of, meaning it is hard to prove. Both are bad for psychological data in general, which is correlation in nature.
Do centrality measures make sense here?
Strength can be used as a sum of edge weights (node strength). This is showcased in the van Borkulo paper when they utilize eLasso to help make networks out of binary data; they do this using the Ising Model:
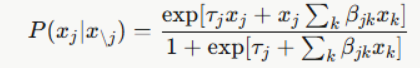
The Ising Model originated from physics, and it gives each binary variable (of 0 or 1) two parameters.
Τⱼ = A threshold notes the baseline tendency this variable has to be turned “on” (have a value of 1) regardless of the neighboring variables Βⱼₖ = An interaction strength that it has with each other variable (variable j and variable k have B strength).
Interactions between these variables cannot be more than in pairs (no three-way). Van Borkulo shows the concept with this equation:
Pair this with L₁ - lasso AKA regularized logistic regression; lasso regresses each variable against all other variables one at a time to shrink the weak connections down to zero. Lasso steps in because using the full Ising model is unrealistic for the size of the data. eLasso is there to estimate one variable at a time through logical regression, which is more palatable than doing so all at once.
eLasso is treating each variable Xⱼ as a response variable and the rest of the variables as predictors of Xⱼ (this is the logical regression). Then the intercept of the regression is Τⱼ (threshold) and the slopes are Βⱼₖ (connection strengths with the neighbors).
Question: This method would not work with just this base concept of logistic regression because it would estimate a non-zero connection with every pair. If this is the case, what do you think happens to the network?
Answer
The network would be fully connected and therefore unable to be interpreted.
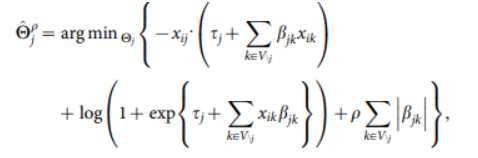
To get the sparse network we want, it’s time to impose an L₁ penalty as shown in this equation:
The penalty shrinks all the small coefficients toward zero and then sets any weak and/or absent connections to exactly zero.
The strength of the shrinking depends on p (penalty parameter). Our challenge is making sure our p is correct.
Question: What do you think happens if p is too big? Too small?
Answer
If p is too big, we miss our real connections; this is a low sensitivity issue -> If p is too small, we include false connections; this is a low specificity issue
To help determine our p, lasso is followed up by the EBIC (Extended Bayesian Information Criterion), which decides what the penalty level is, in order to control the false positives. Using the following equation, EBIC chooses from 100 different p-values which neighborhood set is correct for each variable:
ℓ(Θ̂ⱼ) is the log-likelihood of the model |J| is the number of neighbors selected n is the sample size, p-1 is the number of predictors γ is a hyperparameter controlling how strongly the criterion penalizes larger models
This equation chooses the lowest EBIC using the y-parameter:
At γ = 0.25 (van Borkulo’s default), EBIC penalizes extra neighbors more strongly, favoring sparser networks with fewer false positives It seems this value performs best for the Ising model in particular, resulting in a low false positive rate At γ = 0, no extra penalty is given for more neighbors, resulting in more estimated connections and higher sensitivity
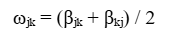
Each pair of nodes (j and k) now has two regression coefficients (βⱼₖ and βₖⱼ). Now we must decide which rule to apply based on how you want to determine an edge exists: AND-rule: An edge exists only if both βⱼₖ and βₖⱼ are nonzero; this is more conservative, with higher specificity; this is the method van Borkulo prefers OR-rule: An edge exists if either βⱼₖ or βₖⱼ is nonzero; this is more liberal, with higher sensitivity
After deciding which set to use, the weight of each edge is defined by averaging the two regression coefficients to create a symmetric undirected network:
And we’ve done it!
Question: What do you think the setback of this method is?
Answer
To avoid false positives, lasso penalizes coefficients towards zero, meaning that weaker but real connections are missed. Van Borkulo argues this is alright because the strongest connections are correctly identified at the cost of missing those weaker ones.
If you mess up p, you will miss hella connections
Bad for large dense networks; small sample performance
Undirected networks only
Question: What do you think the setback of using the Ising model is in general?
Answer
The domain choice is made theoretically, so heavy justifications have to be made > Since researchers typically set small parameters to 1 during ℓ₁-regularized estimation, the two different domains can produce non-equivalent models (the penalty will act differently on the different domains)
Researchers commonly omit thresholds from their reports, making it nearly impossible to reuse or replicate the research
The conclusions rely heavily on which domain is chosen
If sensitivity is preferred over specificity, van Borkulo proposes two methods: Set γ = 0 to remove the extra EBIC penalty on model size, allowing more connections Use the OR-rule, which accepts an edge if either regression direction is nonzero
This method raises sensitivity and does not drop specificity too drastically.
Question: Does a correlation have “strength”?
Answer
Yes, correlation can have “strength” as showcased in the Ising Model above


 Pair this with L₁ - lasso AKA regularized logistic regression; lasso regresses each variable against all other variables one at a time to shrink the weak connections down to zero. Lasso steps in because using the full Ising model is unrealistic for the size of the data. eLasso is there to estimate one variable at a time through logical regression, which is more palatable than doing so all at once.